Graphs and Charts to display your Golf Stats
|
ChartMyGolf has a multitude of graphs and charts available
to you for you to see your golf stats in a visual form.
This will make it easier for you to find any areas where you can improve your game.
See the
tutorial
to help give you some additional ideas on how to analyse your game.
|
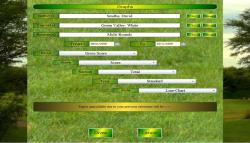
Since there are so many graphs and charts available to you in
ChartMyGolf we have developed this simplified
graphs access table for your convenience.
When you want to draw a graph or chart start from the top of this dialog box and work down.
As you move down some of the choices in the lower combo boxes will be greyed and unavailable
since your earlier selections make these lower selections invalid.
Each section is described in detail:
Selecting Golfers,
Selecting Courses,
Selecting Rounds,
Selecting Rounds By Date,
Focus,
Golf Score,
Total,
Type and
Style,
Golfers
First select the golfer(s) you want to focus on.
You can select a single golfer or multiple golfers.
(Choosing multiple golfers will make some
selections
invalid options in the choices below.)
There are two buttons on the right of the Golfer combo box which speed up the selection process.
Clicking All will select all the golfers and clicking None will deselect all the golfers in the
combo box.
To select a single golfer, click on the white area of the combo box and a drop down list
will appear. Scroll and select the golfer with a click of the mouse.
If you click another golfer, your previous selection will be deselected and your new selection
will be high-lighted instead.
When working with multiple golfers you use the CTRL (control) key on your keyboard. There are
usually two of these.
If you want to add a golfer to your present list of selected golfers, press the CTRL-key and keep
it depressed, and then click the additional golfer(s) you want to add to your list of selected golfers.
Once you are happy release the CTRL-key.
If you want to remove a golfer from your present list of selected golfers, press the CTRL-key and
keep it depressed, and then click the golfer(s) you want to remove from your list of selected golfers.
Again, once you are happy release the CTRL-key.
In short, when working with multiple selections keep the CTRL-key pressed.
Course/Tees
Now select the tees you want to focus on.
You can select a single set of tees or multiple tees.
(Choosing multiple tees will make some selections, such as gross score, invalid options in the
choices below. This is due to sets of tees having different pars so comparisons of gross scores
becomes meaningless.)
There are two buttons on the right of the Course combo box which speed up the selection process.
Clicking All will select all the course/tees and clicking None will deselect all the tees in the
combo box.
To select a single course/tees, click on the white area of the combo box and a drop down list
will appear. Scroll and select the tees with a click of the mouse.
If you click another set of tees, your previous selection will be deselected and your new selection
will be high-lighted instead.
When working with multiple tees you use the CTRL (control) key on your keyboard. There are
usually two of these.
If you want to add a set of tees to your present list of selected tees, press the CTRL-key and keep
it depressed, and then click the additional tees you want to add to your list of selected tees.
Once you are happy release the CTRL-key.
If you want to remove a set of tees from your present list of selected tees, press the CTRL-key and
keep it depressed, and then click the tees you want to remove from your list of selected tees.
Again, once you are happy release the CTRL-key.
In short, when working with multiple selections keep the CTRL-key pressed.
Rounds
Now select the rounds you want to focus on.
All the rounds played by the previously selected golfer(s) on the previously selected
course/tees will be available in the Round combo box.
You can select a single round from this list or multiple rounds.
(Choosing multiple rounds will make some selections, such as Round Summary, invalid options in the
choices below.)
There are two buttons on the right of the Rounds combo box which speed up the selection process.
Clicking All will select all the rounds and clicking None will deselect all the rounds in the
combo box.
To select a single round, click on the white area of the combo box and a drop down list
will appear. Scroll and select the round with a click of the mouse.
If you click another round, your previous selection will be deselected and your new selection
will be high-lighted instead.
When working with multiple rounds you use the CTRL (control) key on your keyboard. There are
usually two of these.
If you want to add a round to your present list of rounds, press the CTRL-key and keep
it depressed, and then click the additional rounds you want to add to your list of selected rounds.
Once you are happy release the CTRL-key.
If you want to remove a round from your present list of selected rounds, press the CTRL-key and
keep it depressed, and then click the round(s) you want to remove from your list of selected rounds.
Again, once you are happy release the CTRL-key.
In short, when working with multiple selections keep the CTRL-key pressed.
Selecting Rounds by Date
As an additional method you can select rounds by date.
Click the calendar icon on the right of the Date From box and a calendar will appear.
Scroll through the months and years and click your chosen date.
Do the same with the icon on the right of the Date To box to select the upper date of your range.
All the rounds within these dates and including both dates will then be selected in the rounds
combo box. If you like you can add additional rounds or even remove some of those selected by using
the methods described above.
Focus
Now you need to select the focus of the graph/table you want to draw.
Gross Score: This is the unaltered actual score.
If you took 4 strokes for a particular hole the gross score will be 4.
If you took 72 strokes for the entire round the gross score will be 72.
The gross score is unaffected by par.
When you are looking at multiple courses this option will be greyed
and unavailable since a gross score will have little meaning for sets of tees with
different pars.
Score v Par: This is the score related to par.
If you took 4 strokes for a par 3 hole the score verses par is +1.
If you took 73 strokes for the entire round on a par 74 set of tees the score verses par will be -1.
Additionally score v par has meaning when looking at elements of the game such as putting.
You are expected to take 2 putts per hole. So if you took 41 putts for the entire round your
putts v par would be +5.
Your score v par is your score compared with the expectation.
When you want to compare cross-course scores this is the option you should
choose as your score will be represented as a plus or minus figure compared to the course's par.
Round Summary: Choose this option if you have selected a single round and would like to see
a summary of it in a table form.
Obviously this option will be greyed and unavailable if you have selected multiple rounds.
Personal Stroke Index: This option ranks the holes of the course into order, 1 to 18, 1
being the most difficult.
The PSI is based on how the selected golfers have played the course on the selected rounds.
You can choose this option for any aspect of your game; score, putts, fairways-hit etc.
This is an excellent way of finding problem holes for particular aspects of your game.
If a very narrow hole had a 1 value PSI for fairways-hit you might consider lessons in straightening
your tee shots or even choosing a more lofted club selection for this hole with your tee shot
to minimise the waywardness for this difficult hole.
Obviously this option is only available when just one course is selected.
However multiple golfers and rounds can be selected.
Note: even though we allow you to calculate the PSI for multiple golfers,
which can mean every single golfer that plays off a set of tees, you should not use this
as a method of ranking holes for competitions. The relevant local authorities do an excellent
job at making sure the Stroke-Indexes of a golf course are fair for every golfer of different
handicaps, for every competition type, for every possible flag placement on the green and even for
every type of weather condition that could be met.
While statistics can have a lot of meaning for self-analysis purposes they would never replace
the experience the local authorities have at balancing the many possible permutations that
can arise.
PSI v SI:
This is the Personal Stroke Index verses the official Stroke Index. The result is a number between 1 and 18.
The hole with value 18 is the hole on which you are most likely going to pick up shots in a competition.
The hole with value 1 is the hole you are most likely going to lose shots in a competition.
Obviously this option is only available when just one course is selected.
However multiple golfers and rounds can be selected.
The PSI v SI is a really valuable tool to plan your rounds and competitions. If you can pick up,
or at the minimum, not lose shots to the pack on the holes with a value of 1-9 and play consistently
on the other holes, you have a good chance of a good placing in that competition.
Golf Score
Now you need to select the scoring element of your game you want to draw.
Score: This is the standard score, ie the number of strokes you have achieved for the hole or round.
Fairways Hit: For a single hole this is either a Yes or No depending on whether the fairway
was hit with your tee shot.
For the entire round, or for the front and back nine, this is a percentage
ratio of the number of times the fairway was hit for each scored-hole in that section.
A high percentage (near 100%) is
good, saying you are hitting the fairway regularly with your tee shot. A low percentage (near 0%)
is saying you are generally missing the fairway with your tee-shot.
Note: On par 3 holes fairways-hit are not scored, as you are expected to hit
the green with your tee-shot.
Fairway Bunkers: This is the number of times you hit a shot out of a bunker located on the
fairway.
Water: This is the number of times you hit a shot into water.
Penalties: This is the number of penalty strokes you are awarded.
Approach Shot:
This is a measure of your shot to the green.
Possible single hole entries are no score, off green, long putt, mid putt and short putt.
If you land on the green the approach shot is the length of putt you are left with.
How you define the putt is up to you.
You might choose short putts to be within a club length or two (including approaches that end up in the hole).
Long putts might be in excess of 20 feet. Its up to you.
If you do not land on the green enter 'off green'.
The Nines and Total score are presented slightly differently.
Instead of a category you get a percentage.
A high percentage near 100% means you are predominantly being left with short putts,
a low percentage near 0% means you are predominantly landing off the green.
Greenside Bunkers: This is the number of times you hit a shot out of a bunker located next to the
green.
Offgreen Chips: This is the number of times you hit a shot from just off the green (and not
in a bunker) with a iron or putter.
Putts: This is the number of putts you take on the green surface.
Fairways Total: This is the total number of shots you take getting to the green or greenside
location.
Greens In Regulation: A Green In Regulation is achieved if you get to the green within two shots
less than par. The additional two shots are assumed to be putts.
For a single hole this is either a Yes or No depending on whether the
green was hit within the expected number of shots. For a par 3 you are expected to hit the green in
1 shot, on a par 4 you are expected to hit the green within 2 shots and on a par 5 you are
expected to hit the green within 3 shots.
For the entire round, or for the front and back nine, greens-in-regulation is presented as a percentage
ratio of the number of times the green was made in regulation for each scored-hole in that section.
A high percentage (near 100%) is good, saying you are regularly hitting the green within the expected
number of shots per hole.
A low percentage (near 0%) is saying you are generally failing to get to the green within the expected
number of shots for that section of the course.
Greens In Regulation + 1: A Green In Regulation + 1 is achieved if you get to the green within one
shots less than par. This statistic may be more useful for bogie golfers (handicaps around 18)
who are trying to determine whether shots are being lost around the green or approaching the green.
Greens In Regulation + 2: A Green In Regulation + 2 is achieved if you get to the green within
par. This statistic may be more useful for double-bogie golfers (those with maximum handicaps)
who are trying to determine whether shots are being lost around the green or approaching the green.
Greenside Total: This is the total number of shots taken around the green, including on-green putts,
greenside bunker shots and off-green chips and putts.
Up and Downs: If you miss the green with your approach shot, landing outside of a bunker,
but still manage to get into the
hole within 2 shots you are said to have achieved an Up and Down.
Note: On a hole where you hit the green or a greenside bunker with your approach
shot the hole is recorded as a No Score (x) for Up and Downs, as the event did not occur.
For a single hole an Up and Down is recorded as a Yes or a No.
The Nines and Total score are presented slightly differently. Instead of a score you get a percentage.
For all holes for which a No or Yes was registered for that section of the course, the percentage is
the ratio of Yes values compared to No values.
In other words a high percentage value (near 100%) is good, saying you are generally holing out within 2 shots even when you
just miss the green.
A low percentage value (near 0%) is bad, saying you are taking 3 or more shots to hole out when you just
miss the green with your approach shot.
Sand Saves: If you managed to get into the hole from a greenside bunker within 2 shots
you are deemed to have successfully achieved a sand save on a hole. If you landed in a greenside
bunker but took 3 or more shots to get into the hole you failed to achieve a sand save.
Holes where you do not land in a greenside bunker are recorded as No Score (x),
as the event did not occur.
The Nines and Total score are presented slightly differently. Instead of a score you get a percentage.
For all holes for which a No or Yes was registered for that section of the course, the percentage is
the ratio of Yes values compared to No values.
In other words a high percentage value (near 100%) is good, saying you are generally holing out within 2 shots even when you
you land in a greenside bunker.
A low percentage value (near 0%) is bad, saying you are not taking 3 or more shots to hole out when you land
in a greenside bunker.
Greens In Regulation per Fairway Hit:
This records whether a Green In Regulation is achived when you also score a Fairway Hit.
This should be higher than your normal GIR value and is a good indication of the success of
shots taken on the fairway.
Greens In Regulation + 1 per Fairway Hit:
This records whether a Green In Regulation + 1 is achived when you also score a Fairway Hit.
This should be higher than your normal GIR+1 value and is a good indication of the success of
shots taken on the fairway for bogie golfers.
Greens In Regulation + 2 per Fairway Hit:
This records whether a Green In Regulation + 2 is achived when you also score a Fairway Hit.
This should be higher than your normal GIR+2 value and is a good indication of the success of
shots taken on the fairway for maximum handicap golfers.
Greens In Regulation per Fairway Miss:
This records whether a Green In Regulation is achived when you fail to score a Fairway Hit.
This statistic is a good indication of how well you can recover when your tee shot goes awry.
Greens In Regulation + 1 per Fairway Miss:
This records whether a Green In Regulation + 1 is achived when you fail to score a Fairway Hit.
This statistic is a good indication of how well bogie golfers can recover when their tee shot goes awry.
Greens In Regulation + 2 per Fairway Miss:
This records whether a Green In Regulation + 2 is achived when you fail to score a Fairway Hit.
This statistic is a good indication of how well maximum handicap golfers can recover when their
tee shot goes awry.
Fairway Miss Save:
This is where you miss the fairway with your tee shot but still get to the green in the expected number
of shots.
Fairway Bunker Save:
This is where you still get to the green in the expected number of shots after hitting a fairway bunker.
Greenside per Off Green Approach: The greenside score for offgreen approaches.
Greenside per Long Putt Approach: The greenside score for long putt approaches.
Greenside per Mid Putt Approach: The greenside score for mid putt approaches.
Greenside per Short Putt Approach: The greenside score for short putt approaches.
General: This is an overall summary of the round.
Total
Now you need to select the hole or section of the course you want to examine.
Total: This is the total score for a full round of golf.
Front Nine: This is the total score for the first nine holes.
Back Nine: This is the total score for the last nine holes.
All Holes: Each hole is presented as an individual event.
If you had a line graph for two rounds 36 points would appear on the graph starting with Hole 1 for
the earliest round and ending in hole 18 for the most recent round.
This is a good way of getting graphs with a lot of information on them when you
have only entered a few rounds.
General: This is an overall summary of the round.
Hole #: Your activity on each hole can be examined separately. This is a good option
to choose when you know a particular hole is causing you problems and you are trying to pin-point why.
Type
Now you need to select the type of graphing process you want to examine.
Standard: This is the typical graph format where a single entry relates to a single point on the graph.
Moving Average: Instead of each point on a graph coinciding with a piece of data, each point
is an mathematical average of that point and some recent previous points.
There are several ways of calculating this average and we have chosen what we believe to be the most
appropriate in this case.
(Its one of the more complicated ones. The most recent data should be the
most important but the older data should still be present without unduely influencing the result.)
This graphing method will smooth out unusual, one-off, scores while at the same time giving you a
good way of seeing the progress you are making.
This is an excellent mathematical method of making sense of data that can rapidly oscillate (for example
between two values) but giving you a clear indication of whether that value is predominantly rising
or declining.
Progress Chart: This is yet another mathematical technique that smoothes
data to present it in a very readable form.
Again all the complicated mathematics is done behind the scenes and is unimportant to the end user.
With this graph the idea of a score or target is completely removed and instead is replaced by a simple
concept of whether you are improving or getting worse.
General improvement is positive, coloured green, and declining standards are negative, coloured red.
Its as simple as that. The mathematics might make your head turn to jelly but the results are a very
simple readable graph. Green is good, red is bad.
It can even be predictive. If you are in the green (generally improving) but have been heading down
to zero and the red-zone for a few points on the graph then this can act as a wake-up call warning
you that you are likely to be heading into the red, getting-worse, zone very soon.
This will give you a chance to discover the problem and maybe get a few lessons from your local
golf-professional.
General: This is an overall summary of the round.
Style
Now you need to select the style of graph you want to view.
Line Chart: This is a basic line chart that draws lines between the points on a the graph.
These graphs are useful when you are plotting golf stats against time and date.
Bar Chart: This graph is useful when looking at information based on discrete (individual)
data points, such as looking at your scores on each hole of a round of golf. Bars (columns) are
drawn to an appropriate height to represent your score and each bar is built up of unit elements.
Pie Chart: This graphing technique is used when you need to show proportion.
For example a pie-chart would be ideal when showing what proportion of scores on a hole were
score 3 or score 4 etc.
Histogram: This is similar to the bar chart but each bar is not built of element building blocks.
Draw
Once you are happy with your selections press the Draw button and your golf stats will be displayed
in graphical or chart form.
Return to the main [Help] menu.